
Use the Education Tax Calculator to compare education related taxes for different years and property values.
This interactive spreadsheet allows you to choose two different years and two different property values and will show the education levies (state and local) and bonds for those years.
Click on the link below to download the Excel file. Or download the Google Sheets version.
See how our local levy rates have changed over time …
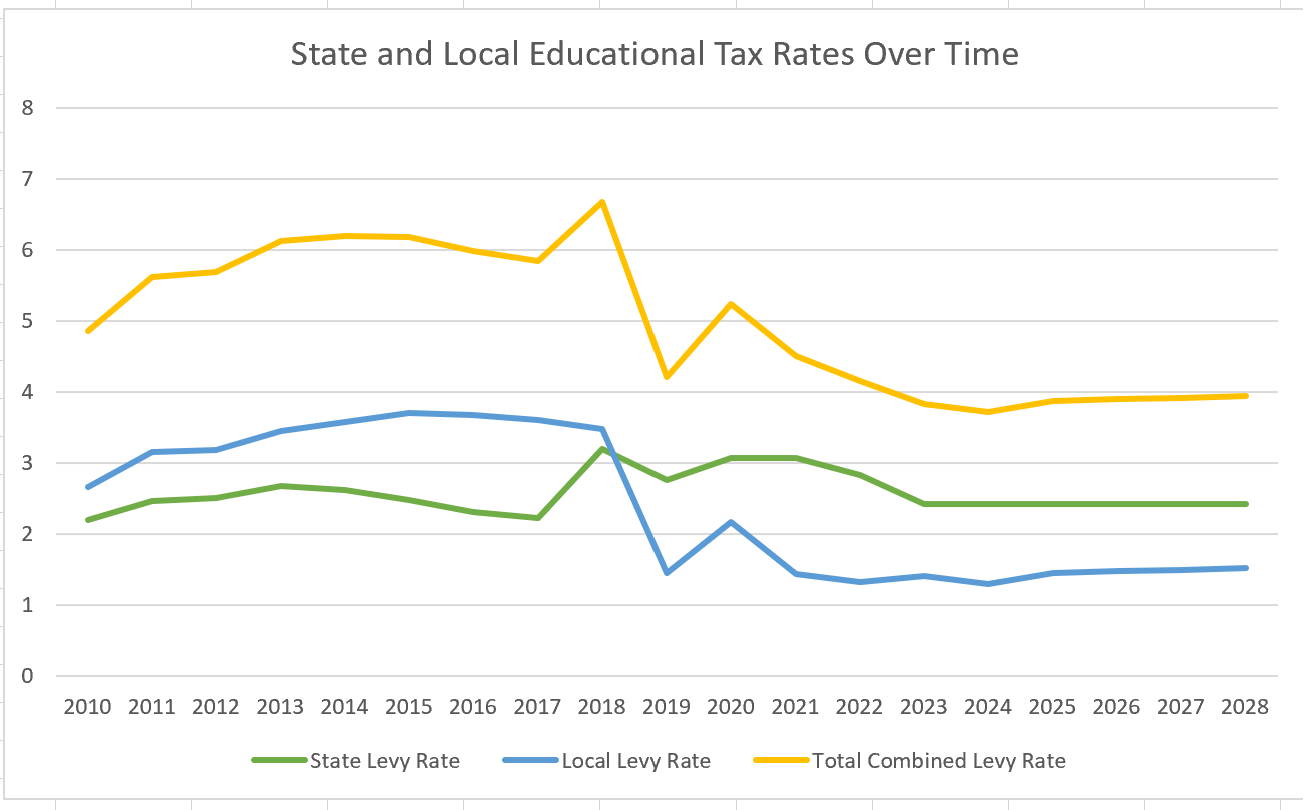
| Year | State Levy Rate | Local Levy Rate | Total Combined Levy Rate |
| 2010 | 2.20 | 2.66 | 4.86 |
| 2011 | 2.46 | 3.16 | 5.62 |
| 2012 | 2.51 | 3.18 | 5.69 |
| 2013 | 2.67 | 3.45 | 6.12 |
| 2014 | 2.62 | 3.58 | 6.20 |
| 2015 | 2.48 | 3.70 | 6.18 |
| 2016 | 2.31 | 3.67 | 5.98 |
| 2017 | 2.23 | 3.61 | 5.84 |
| 2018 | 3.20 | 3.48 | 6.68 |
| 2019 | 2.76 | 1.45 | 4.21 |
| 2020 | 3.07 | 2.17 | 5.24 |
| 2021 | 3.07 | 1.41 | 4.51 |
| 2022 | 2.83 | 1.30 | 4.15 |
| 2023 | 2.42 | 1.41 | 3.83 |
| 2024 | 2.42 | 1.30 | 3.72 |
| 2025 | 2.42 | 1.45 | 3.90 |
| 2026 | 2.42 | 1.48 | 3.90 |
| 2027 | 2.42 | 1.50 | 3.92 |
| 2028 | 2.42 | 1.52 | 3.94 |

You must be logged in to post a comment.